A synthetic dataset of 2000 ChIP-seq peaks designed to mimic the output of
DiffBind::dba.report(dba, th = 1, bCounts = TRUE) for a C. elegans
dosage compensation experiment.
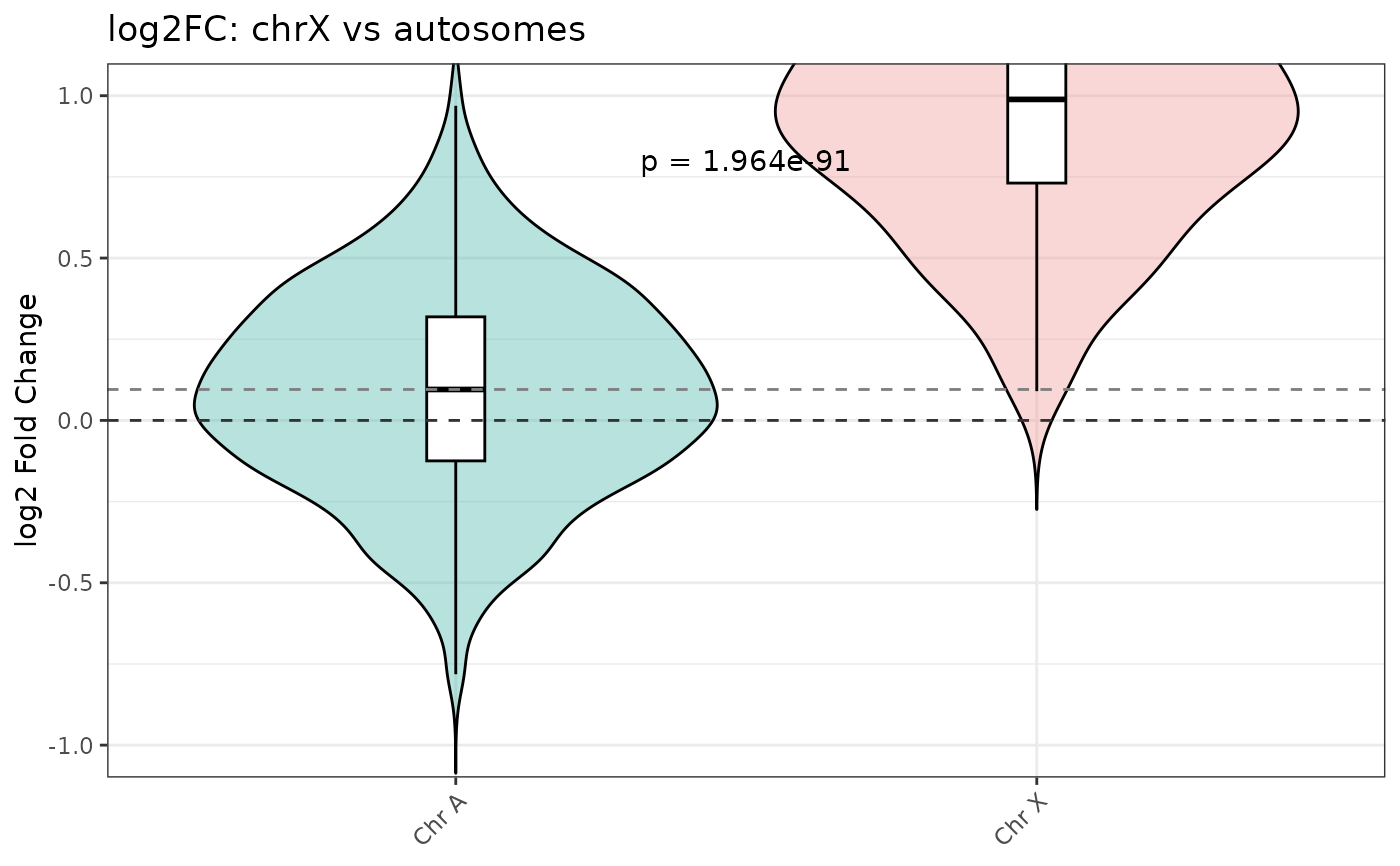
Peaks on chrX are simulated to have higher fold change under the degron condition, reflecting dosage compensation loss when the relevant factor is degraded.
Format
A data.frame with 2000 rows and 11 columns:
- seqnames
Character. Chromosome name (
chrI-chrV,chrX).- start
Integer. Peak start position (bp).
- end
Integer. Peak end position (bp).
- width
Integer. Peak width in bp (always 501).
- strand
Character. Always
"*"(unstranded ChIP-seq).- Conc
Numeric. Average normalized binding count across conditions.
- Conc_degron
Numeric. Normalized counts for the degron condition.
- Conc_notag
Numeric. Normalized counts for the no-tag baseline.
- Fold
Numeric. log2 fold change (degron / notag).
- p.value
Numeric. Raw p-value from DiffBind.
- FDR
Numeric. Benjamini-Hochberg adjusted p-value.
Source
Generated synthetically via data-raw/example_peaks.R.
Proportions and effect sizes are based on a real C. elegans
dosage compensation ChIP-seq experiment.
Examples
data(example_peaks)
head(example_peaks)
#>   seqnames    start      end width strand   Conc Conc_degron Conc_notag    Fold
#> 1   chrIII 13387688 13388188   501      * 6.9994      6.9690     7.0298 -0.1354
#> 2    chrII  5347141  5347641   501      * 8.6492      8.9199     8.3784  0.5320
#> 3    chrIV  4411828  4412328   501      * 7.3995      7.5176     7.2815  0.4550
#> 4     chrI  8998351  8998851   501      * 8.1467      8.1683     8.1250  0.1262
#> 5   chrIII 10718491 10718991   501      * 9.5817      9.5901     9.5732 -0.2132
#> 6     chrI    22078    22578   501      * 8.1004      8.4593     7.7414  0.7737
#>    p.value    FDR
#> 1 0.258400 0.7771
#> 2 0.006839 0.2608
#> 3 0.314800 0.8364
#> 4 0.692100 0.9568
#> 5 0.845600 0.9770
#> 6 0.948800 0.9954
table(example_peaks$seqnames)
#>
#>   chrI  chrII chrIII  chrIV   chrV   chrX
#>    353    347    315    360    407    218

# Quick violin plot
violin_log2FC(
  object = example_peaks,
  title  = "log2FC: chrX vs autosomes"
)